Dashboard-Overview
Cloud and container usage can be monitored with a single click using 25+ metrics provided by StackBill CMP.
- Cloud and Container usage can be monitored in a single click using 20+ metrics provided by StackBill CMP.
- Click on the Monitoring dropdown button below the Apps icon, Which is available in the top left corner. from the dropdown, Click on Dashboard.
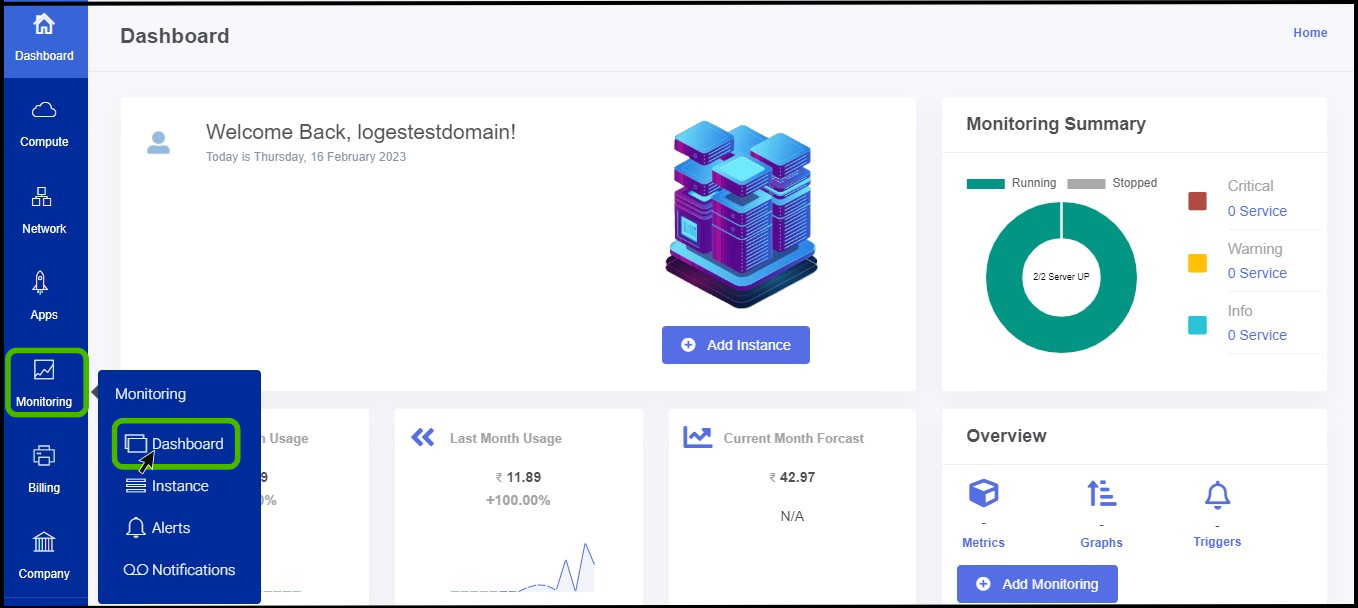
- The Monitoring Dashboard screen appears.
- Here user can monitor their overall resources usage.
- An overview of the usage is available in the dashboard, along with metrics, triggers, and graphs.
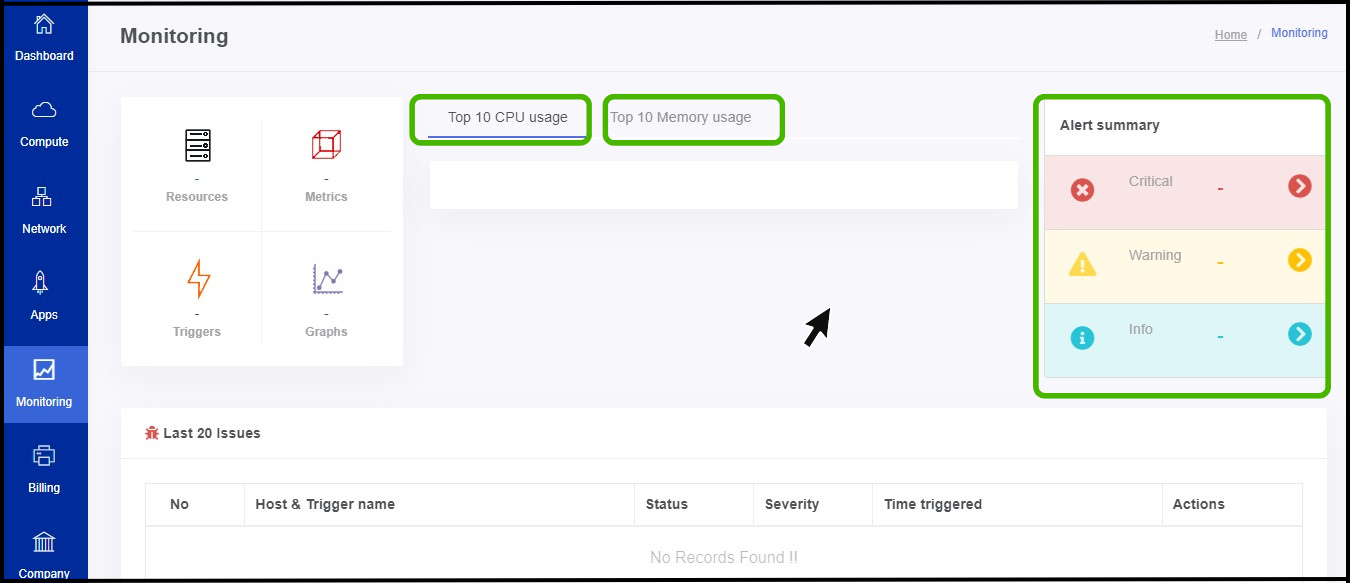
- It is also possible to view both CPU and Memory usage.
- On the left side of the portal, the user can able to view the alert summary of the resources.
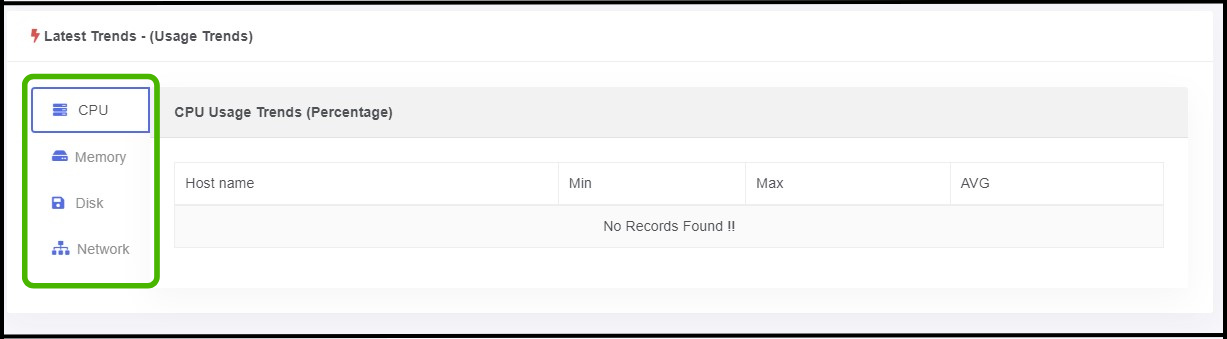
- The user can view a detailed view of resource usage here.
- An Overview of CPU usage can be viewed by clicking on the CPU option in the menu.
- An Overview of Memory usage can be viewed by clicking on the Memory option in the menu.
- The Disk and Network options on the menu provide detailed usage reports for Disk and Network.